by Vikram Kotwani – Principal Architect
Oracle Automatic Workload Repository (AWR)
AWR is a monitoring tool that collects, analyzes, and stores performance statistics, helping database administrators identify and resolve performance problems. When tuning a database, each component has its own unique set of statistics. To provide a common scale for comparison, database performance statistics are reported in a database-timed model. This model offers details on how much time is spent on performing database activities.
Running Oracle AWR Reports
One can generate the AWR report either through Oracle Enterprise Manager or via command line.
Running AWR from Command Line
To run AWR from the command line on the server where the database is installed, go to $ORACLE_HOME/rdbms/admin
Login to database:
sqlplus “/as sysdba”
@./awrrpt.sql
Type in HTML or txt for report type
Enter the value for num_days, for the number of days you want to see AWR snapshots.
Enter the start and end snapshots, enter filename, and select enter.
Running AWR from Oracle Enterprise Manager
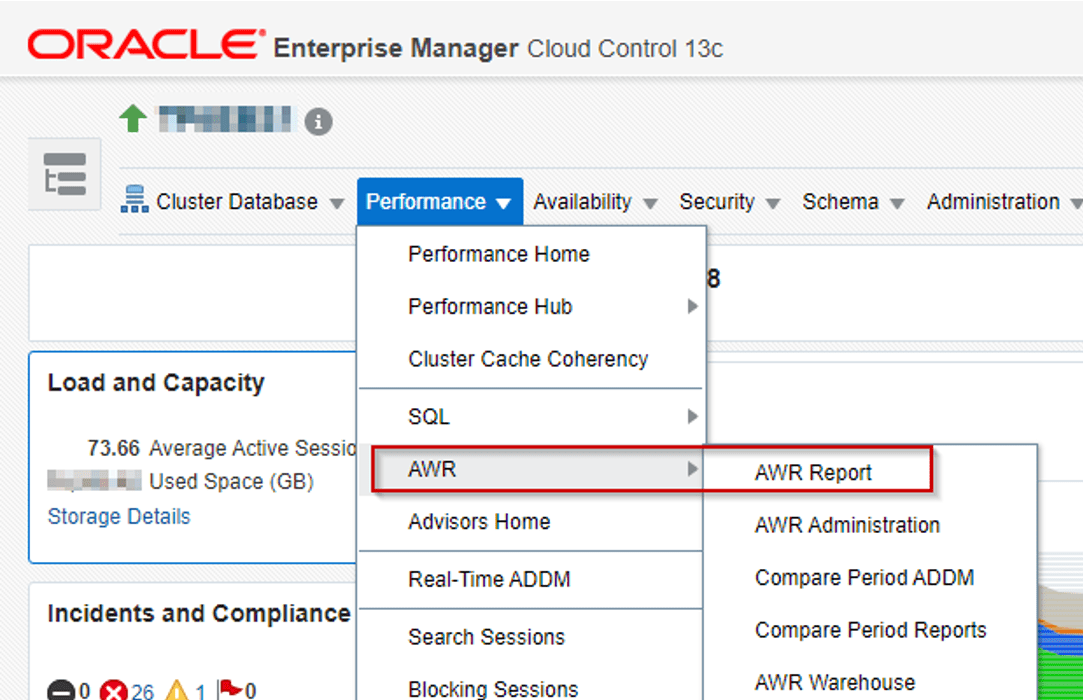
Access the AWR Report by navigating to Performance -> AWR -> AWR Report on the database page.
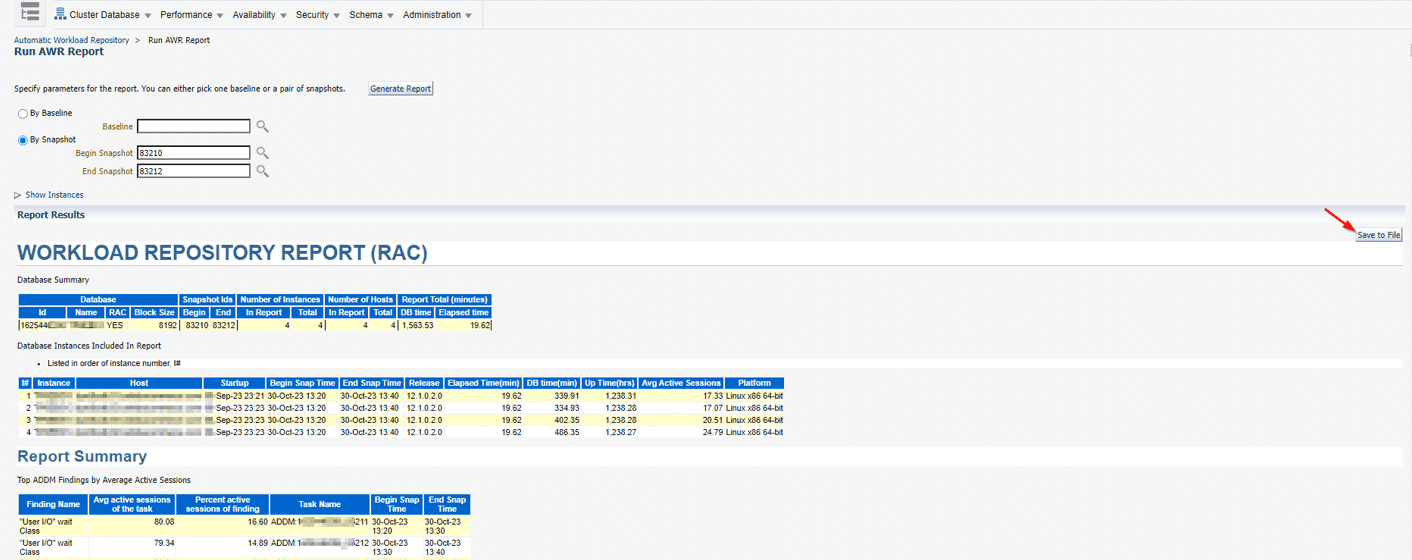
Click the search button, choose the Begin and End snapshots, then select Generate Report. Once the report is generated, click the Save to File button to save the report to your local drive.
Reading AWR Reports
The AWR has multiple sections that cover various database activities. To find what you need quickly, you may want to navigate directly to the appropriate section. Important sections in the AWR are discussed below:
Top Timed Events
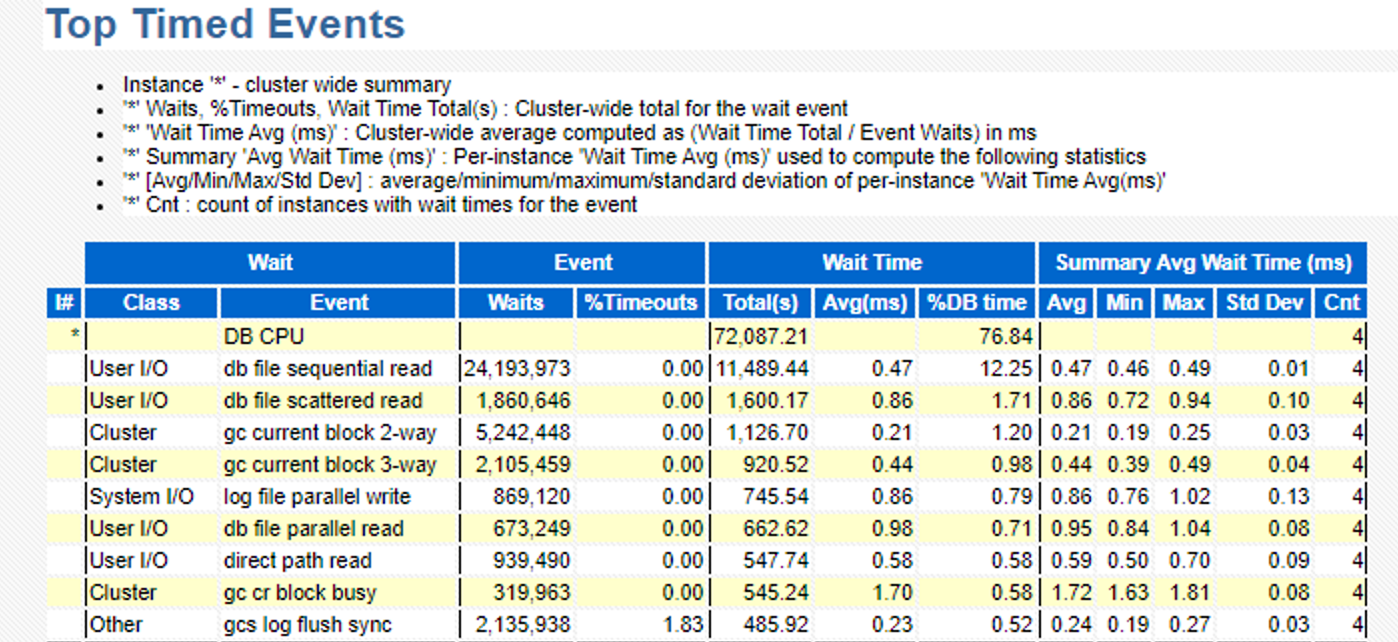
The Top Timed Events section provides an overview of CPU and I/O constraints and displays where the most time is spent waiting for resources. Further breakdowns are available in the Foreground and Background Events sections.
System I/O Statistics
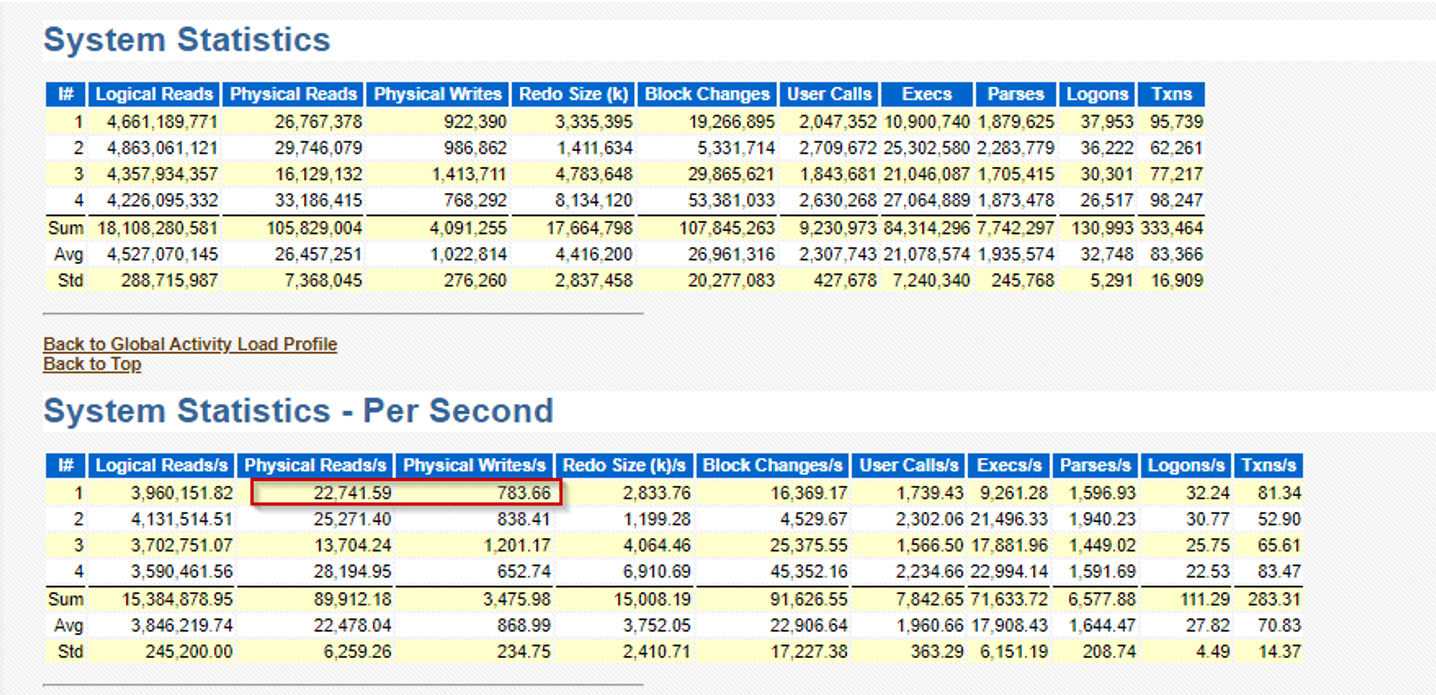
In the System I/O Statistics section, you can view the overall system statistics and confirm if the I/O subsystem can handle the I/O demands made by the database. You can also verify the redo log switches and adjust the size of the redo logs to ensure that there are 3 to 4 switches per hour.
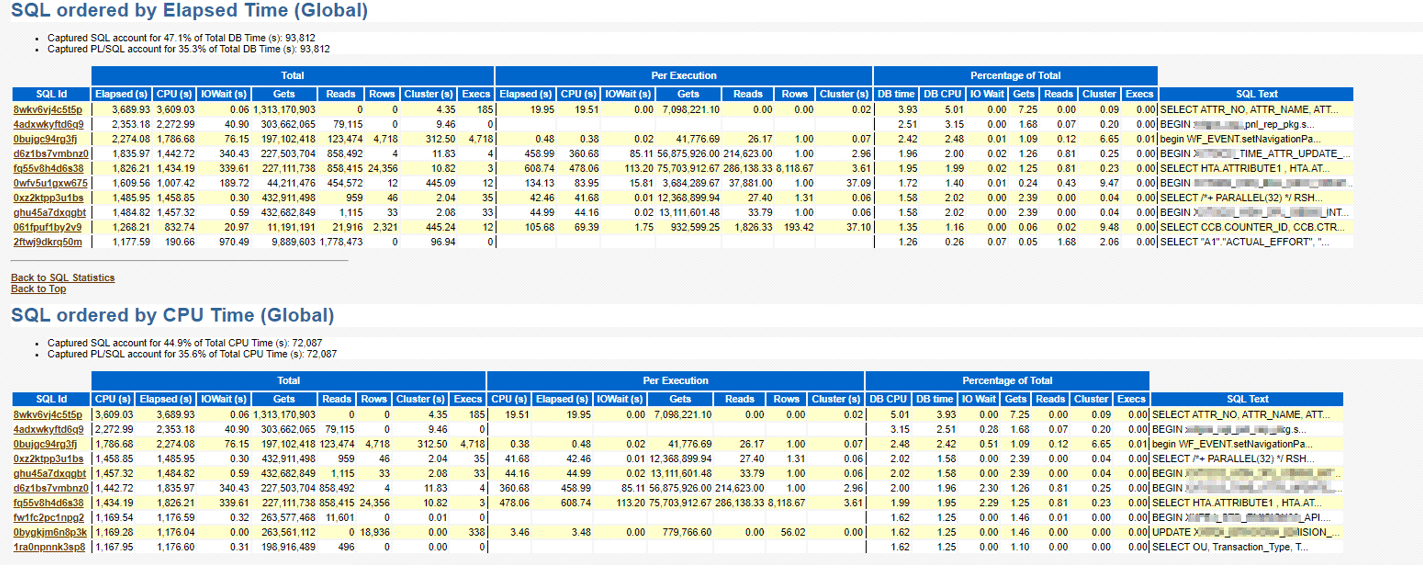
SQL CPU & I/O Consumption
In this section, you can find details about the SQLs that were executed during the AWR interval. This section is important because it helps identify which SQLs were using the most system resources, leading to performance degradation. The SQLs with high consumption of CPU, I/O, or unoptimized reads are good candidates for tuning.

Segment Statistics
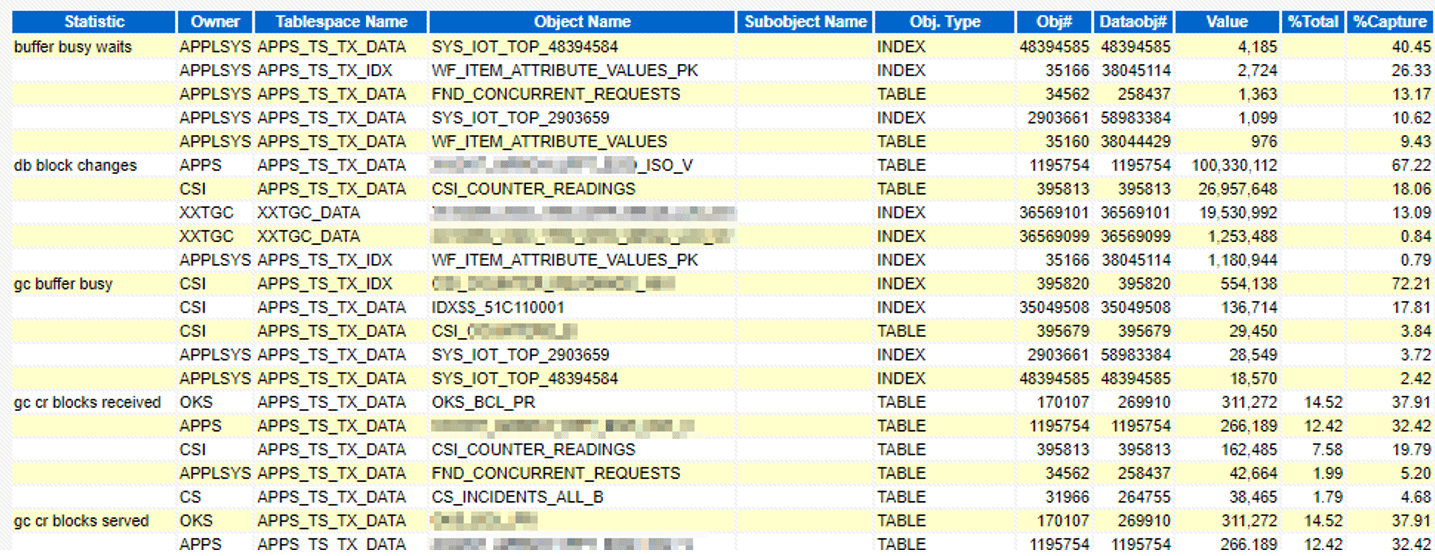
The Segment Statistics section provides a list of the most active segments. You can review this list to determine if any of the segments could benefit from a reorg or purpose of data, etc.
Active Session History (ASH)
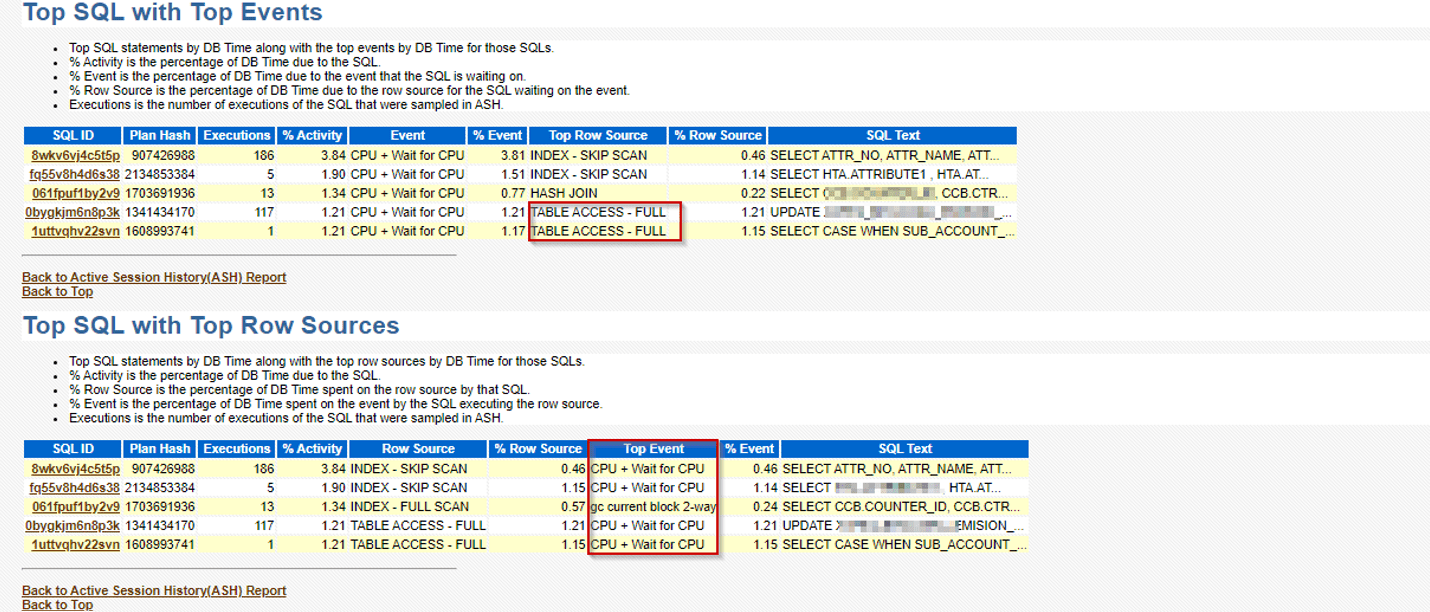
The ASH section provides information about active sessions and other relevant information. The following information can be found within the ASH sections:
SQL With Top Events & Row Sources
This section lists information about the relevant SQLs executing full table scans and waits events.
Top Sessions
This section shows which user sessions consume the most resources.

Automatic Database Diagnostic Monitor (ADDM)
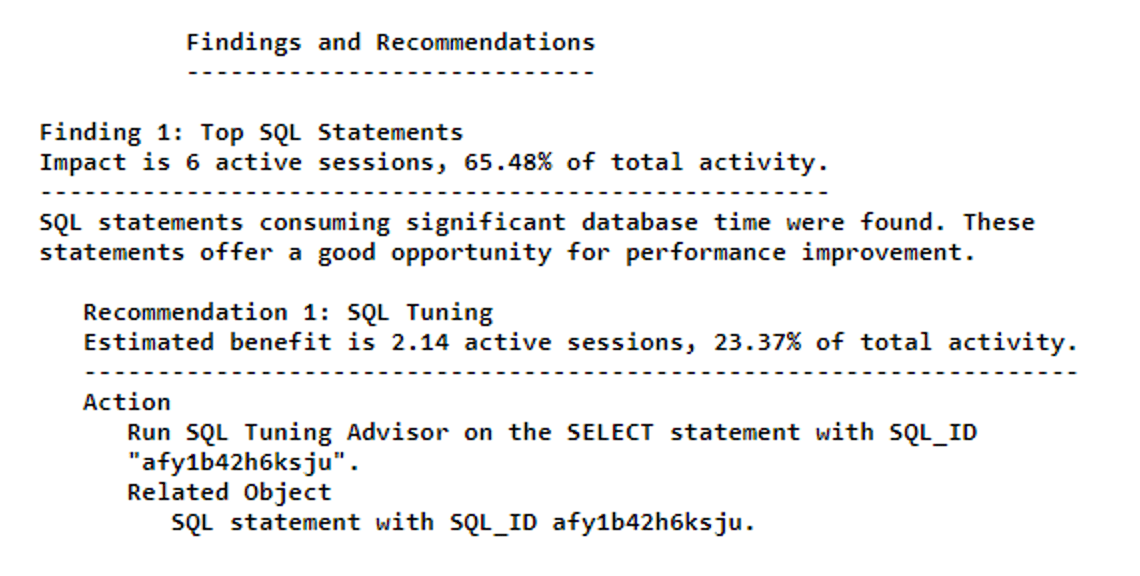
ADDM is a diagnostic tool that analyzes the data in the Automatic Workload Repository (AWR) and provides recommendations for resolving issues found. ADDM often suggests utilizing Tuning Advisor to improve the execution of certain SQL. The recommended next steps would be to execute SQL tuning advisors on the identified SQL and review the various recommendations provided.
Have Questions about Oracle AWR Report Best Practices?
If you find yourself with questions or in need of clarification regarding the best practices for AWR Reports, please contact our expert team or the author directly to learn more.
Vikram Kotwani – Principal Architect


